Monterey Fisheries: Three NOAA Datasets, One PostgreSQL Database, and Numbers That Held Up
I took commercial fish landings, harbor tide readings, and offshore buoy readings, three public datasets from three publishers in three file formats, and built one PostgreSQL database that can answer a real question: does the catch move with the ocean? Then I tested what the database could and could not prove.
Catch data and ocean data live in different places
A fisheries monitoring program wants to know whether what boats bring to the dock is tied to what the ocean was doing that month. The answer needs data from three publishers that were never designed to fit together.
| Source | Publisher | Format | What it holds |
|---|---|---|---|
| California Fish Market Catch Landings | NOAA CoastWatch ERDDAP | CSV | Pounds landed per species per port per month |
| Tide gauge 9413450 | NOAA CO-OPS API | JSON | Monthly water level summary for the Monterey harbor |
| Buoy 46042, Monterey Bay | NOAA National Data Buoy Center | Plain text, one file per year | Hourly wind, wave, temperature, and pressure readings |
I anchored everything on one port, Monterey, California, for 1998 through 2002. That window is the full overlap of all three sources. The shared key is place plus month, which meant aggregating hourly buoy readings up to months. That is a design decision with consequences, and later sections show what it did to the results.
Eight tables, eight relationships
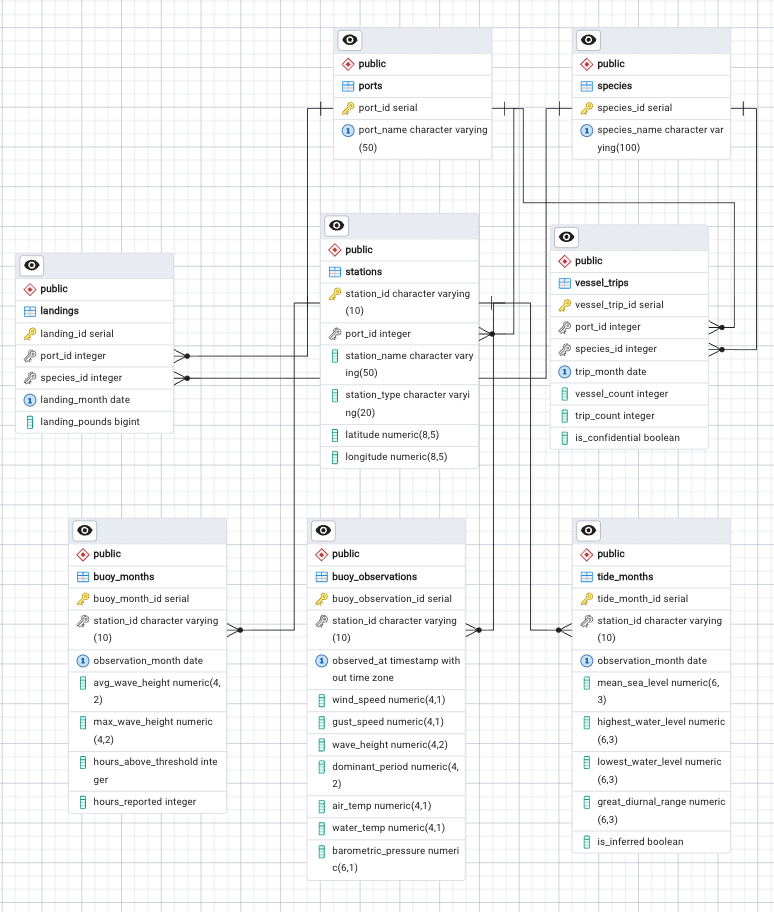
The structure follows the shape of the data, not a template.
- Lookup tables for ports, species, and stations. A fish species name is stored once. The 20,460 landing rows point to it. A second port can be added without changing the structure.
- A landing is unique by port, species, and month. That is a composite rule in the database, so the same record cannot be loaded twice.
- NOAA's own station numbers are the keys. Every reading traces back to the publisher's ID instead of a number I invented.
- Zero and empty are different on purpose. A zero means boats reported and landed nothing. An empty value means no report was filed. Mixing them up would quietly change every average.
- Hourly readings and monthly summaries both kept. The 36,824 hourly rows stay available. A monthly rollup table carries the number of hours reported, so a month built from four days of readings cannot pass for a full one.
The database enforces 34 named rules itself: 8 primary keys, 8 foreign keys, 7 unique rules, and 11 check rules, plus 31 columns that cannot be left empty. Naming followed one convention throughout, plural lower case table names and full ID names such as species_id.
What the raw files did wrong, and what caught it
Public data is not clean data. Four problems showed up, and the design handled each one on purpose.
| Problem | What it would have done | How it was handled |
|---|---|---|
| NOAA writes a failed sensor as 99.0, 999, or 9999.0, depending on the instrument | Fake wave heights and temperatures that look like real numbers | Converted to empty values at load. A check query confirmed zero sentinel values left in the table. |
| The 1998 buoy file repeats 24 hourly readings around August 27, three copies each | August 1998 average wind would read 6.42 m/s instead of the true 6.65, and nothing would flag it | The unique rule on station and timestamp rejected 48 duplicate rows. The load keeps one copy. |
| The landings CSV has a units row directly under the header | A garbage record loaded as data | Skipped in the load script and noted in the data dictionary. |
| 8 of 60 months have landings but no buoy data | An ordinary join drops those months silently. Totals come out 5.2 percent low with no error. | Every query starts from the full list of months and uses an outer join. The gap is reported, not hidden. |
Why this matters to a team: four of the six bias controls in the analysis came from the database design itself, not from extra cleanup code. When someone else runs a report next year, the protections are still there.
Five business questions, answered in SQL
The five questions below are framed the way a manager would ask them, then answered with joins, grouping, window functions, a CTE, and a set operation. Every number came from the loaded database.
| Question | Answer |
|---|---|
| 1. Which species carry the port? | Pacific sardine 42.2%, market squid 29.0%, northern anchovy 17.0%. Three schooling fish carry 88% of 304,307,018 pounds. |
| 2. Which months have landings but no buoy reading? | 8 months holding 15,821,764 pounds, 5.2% of everything landed. Any report on ocean effects has to say it cannot see them. |
| 3. Did rougher seas bring in fewer pounds? | The roughest quarter of months landed 22% less than the calmest. The link is weak (correlation of negative 0.23) and all rough months fall between November and March, so weather and season cannot be separated. |
| 4. What is the full inventory of ocean readings across both instruments? | 112 monthly rows. The tide gauge reported all 60 months, the buoy 52. A UNION, not a join, because the tables describe different stations. |
| 5. Which species landed in all 60 months? | 12, all bottom fish led by Dover sole, together just 4.9% of the pounds. The big volume comes from seasonal fish. |
The query behind question 2
This is the one that shows why join choice matters. The outer join keeps every landing month, then finds the ones with no buoy match.
SELECT l.landing_month, COUNT(*) AS landing_rows,
       SUM(l.landing_pounds) AS pounds_with_no_buoy_reading
FROM landings l
INNER JOIN stations s    ON s.port_id = l.port_id
                        AND s.station_type = 'buoy'
LEFT JOIN buoy_months b  ON b.station_id = s.station_id
                        AND b.observation_month = l.landing_month
WHERE b.buoy_month_id IS NULL
GROUP BY l.landing_month
ORDER BY l.landing_month;
I also measured speed. PostgreSQL rolled all 20,460 landing rows into 341 species totals in 5.9 milliseconds, measured with EXPLAIN ANALYZE. The database carries 20 indexes.
Three roles, each tested on what it must be refused
A database is only trustworthy if the wrong person cannot change it. I set up three login roles through groups, then logged in as each one and tried something it should be allowed to do and something it should not. The refusals are the proof.
| Role | Can | Tested refusal |
|---|---|---|
| Analyst, for an outside research partner | Read every table | Permission denied on any change to landings |
| Monthly loader | Add and correct rows in the five monthly tables, never delete | Permission denied on the landings and lookup tables |
| Admin | Full rights | Not applicable |
No passwords appear in the build script. Each login gets its password set directly on the server.
Does the catch move with the ocean? Tested four ways
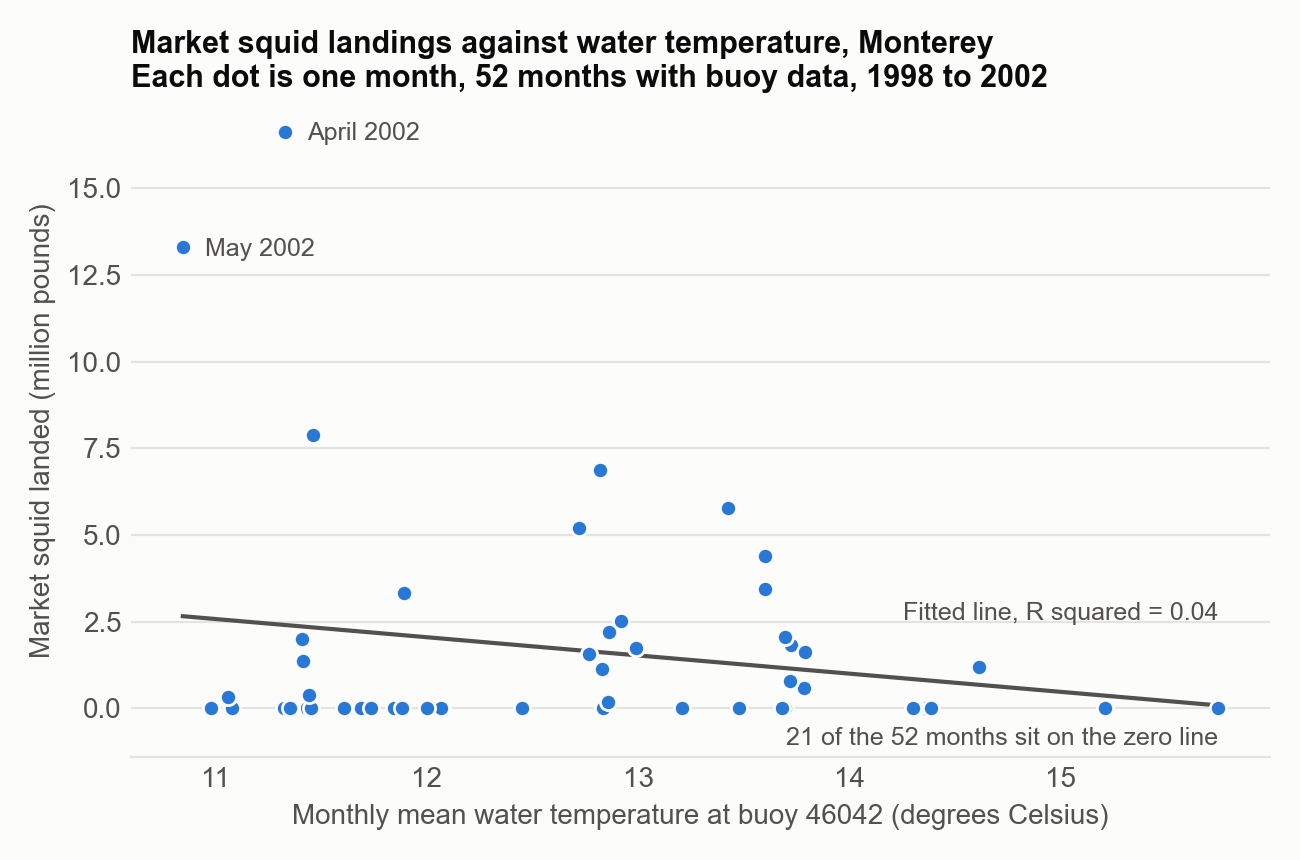
I joined the three sources on month and tested the question for market squid, the species with the sharpest swings. Everything was done in Python reading the live database in a read-only session.
| Test | Result | Plain reading |
|---|---|---|
| Descriptive statistics | For all three top species, standard deviation exceeds the mean. Squid median month: 34.5 pounds against a mean of 1,473,010. | A few huge months carry the average, so I report medians beside means. |
| El Nino year vs La Nina year (Welch's t test) | t = -1.02, p = 0.33 | Not significant. Squid was nearly absent in both years. |
| All five years (ANOVA, confirmed by Kruskal-Wallis) | F = 5.76, p = 0.0006 | The years clearly differ. Squid went from zero pounds in 1998 to 55 million in 2002. |
| Regression: water temperature alone | R squared 0.038, p = 0.167 | Temperature alone explains under 4% of monthly change. |
| Regression: temperature plus wave height | R squared 0.297, both slopes significant | About 30% explained. Warmer water and higher waves went with less squid. |
What I checked before trusting the regression
The model's assumptions failed. The residuals were not bell shaped, their spread was uneven, and each month tended to follow the one before it. The zero months are the root cause, and the model even predicts negative landings for 11 months. So I reran it with Newey-West standard errors, built for months that follow each other, and both slopes stayed significant. I also reran it without 1998, the strongest El Nino year, and the temperature slope held.
Six sources of bias, each measured
- Missing buoy months cluster in early 1998, the height of the El Nino, so they are not random. I kept them as empty instead of estimating them.
- Thin months built from four days of readings were removed in a rerun. The result did not change.
- 81.3% of landing rows are zero. I worked one species at a time and added rank-based tests.
- Duplicate buoy hours were stopped by the database before they reached any average.
- The join gap was worth 15.8 million pounds and was closed by query design.
- One El Nino in five years is a sample of one event. I limited every claim to this window.
What I would and would not claim: in these five years, warmer water and higher waves went with less squid at the dock, and together they account for about 30% of the monthly change. I would not claim they caused it. Wave height is partly a stand-in for the calendar, landings measure sales and not fish in the water, and 70% of the change is unexplained.
Should the database move to NoSQL? My answer was no
The final deliverable was a recommendation to a decision-maker: move this database to a nonrelational system, or not. I made the case for moving and the case against, using this database's actual numbers, then recommended staying on PostgreSQL and adding one JSONB column to the hourly buoy table.
- The one real argument for NoSQL was that sensor failures are messy. A document store would simply omit a broken field.
- Against it: every question asked of this data is a join or an aggregation, the 34 rules already caught 48 bad rows, and the whole database is 18 megabytes, so the scaling argument does not apply.
- The compromise: JSONB gives flexible storage for new instrument fields inside the relational design, with the seven daily-use measurements kept as real columns.
- What would change my mind: more than about ten stations or a million readings, NOAA changing its fields year to year, a live streaming feed, or a main question that becomes one station's history.
I also wrote the full eight-week, six-phase migration plan for the case where the decision goes the other way. It includes a validation gate of seven numbers that must match across both systems, because a migration that changes the answer has failed even when every row moved.
What this is, and what it is not
This is a graduate course project built on public NOAA archive data from 1998 through 2002. It is not a production system and it is not live. The data does not change, so the database is a closed archive.
One table, vessel_trips, is built but empty. It was designed for boat counts that I never downloaded. That is the missing piece for the biggest open question in the analysis: whether the squid were gone or the boats stayed in port.
The statistics describe five years and one El Nino event. They are not a forecast.
What it does show is how I work with data: design the structure around the questions, let the database enforce the rules, measure the bias before reporting a result, and say plainly what a number does not prove.
See the build yourself
The full SQL script builds the structure, loads the data, and sets access from an empty server. It is the exact file I submitted. The NOAA sources are public, and the endpoints are listed in the table at the top of this page.